Anderson Dynamics · Flagship system

WINGATES

Better outcomes and smaller losses, built around what each company actually needs: the research, the data work, and the operational record underneath every decision.

What it is for

Better outcomes.
Fewer losses.

No two operations lose money in the same place. Wingates starts from the question a company actually has, such as where time, fuel, capacity or output is leaking, and builds the research and the record it takes to answer it.

Underneath, the discipline is the same everywhere. Every figure carries the source it came from and the rule that chose it, and a gap stays a gap until a source can fill it. A number that cannot show its working does not reach a decision.

It runs as three separate ecosystems, each designed for one kind of operation.

Wingates
Ontology System

An ontology is a map of the real things in your business and how they connect: the aircraft, the plants, the people, the events. Wingates puts every system’s data onto that map, so your team and AI always work from the same picture.

  1. ConnectBring in the data you already have, from every system you run.
  2. MapEach record is attached to the real thing it describes.
  3. DecidePeople and AI work from one picture, and every answer shows where it came from.
The Wingates Ontology System, drawn as seven stacked layersFrom top to bottom: raw data – files, feeds and logs from every system you run. All of it is there, and none of it can be seen; structured data – every record is cleaned, typed and put in rows, in one shape whichever system it came from; semantic grounding – each record is attached to the real thing it describes, and to the things that one touches; composable segments – the picture is cut into parts with a clear edge. Each works on its own and fits the next; infrastructure & governance – who may see what, who changed it and when. Access and audit are part of the record; human expertise – the people who know the operation review, correct and approve, and their judgement is kept; demand signals – what the operation is asking for next, read from the same picture everyone else is using. The first two layers connect the data, the next three map it, and the last two are where people decide.01 Connect02 Map03 DecideRaw dataFiles, feeds and logs from everysystem you run. All of it isthere, and none of it can be seen.The black boxOpaque until it is opened.Structured dataEvery record is cleaned, typedand put in rows, in one shapewhichever system it came from.Organised flowOne way in, one shape out.Semantic groundingEach record is attached to the real thing itdescribes, and to the things that one touches.Sequence and logicWhat links to what, and in which order.Composable segmentsThe picture is cut into parts with a clearedge. Each works on its own and fits the next.Clear scopeTake one part now and add the next later.Infrastructure & governanceWho may see what, who changed it and when.Access and audit are part of the record.Traceable valueEvery figure walks back to its source.Human expertiseThe people who know the operationreview, correct and approve, andtheir judgement is kept.Judgement on the recordApproved by a named person, not assumed.Demand signalsWhat the operation is asking for next, readfrom the same picture everyone else is using.The next decisionMade on what can now be seen. The Wingates Ontology System, drawn as seven stacked layersFrom top to bottom: raw data – files, feeds and logs from every system you run. All of it is there, and none of it can be seen; structured data – every record is cleaned, typed and put in rows, in one shape whichever system it came from; semantic grounding – each record is attached to the real thing it describes, and to the things that one touches; composable segments – the picture is cut into parts with a clear edge. Each works on its own and fits the next; infrastructure & governance – who may see what, who changed it and when. Access and audit are part of the record; human expertise – the people who know the operation review, correct and approve, and their judgement is kept; demand signals – what the operation is asking for next, read from the same picture everyone else is using. The first two layers connect the data, the next three map it, and the last two are where people decide.ConnectRaw dataFiles, feeds and logs fromevery system you run. Allof it is there, and noneof it can be seen.ConnectStructured dataEvery record is cleaned,typed and put in rows,in one shape whicheversystem it came from.MapSemantic groundingEach record is attachedto the real thing itdescribes, and to thethings that one touches.MapComposable segmentsThe picture is cut into partswith a clear edge. Each workson its own and fits the next.MapInfrastructure &governanceWho may see what, who changedit and when. Access and auditare part of the record.DecideHuman expertiseThe people who know theoperation review,correct and approve, andtheir judgement is kept.DecideDemand signalsWhat the operation isasking for next, readfrom the same pictureeveryone else is using.

Ecosystems

Three separate systems, each designed for one kind of operation and run on its own.

Mcloud

Aviation
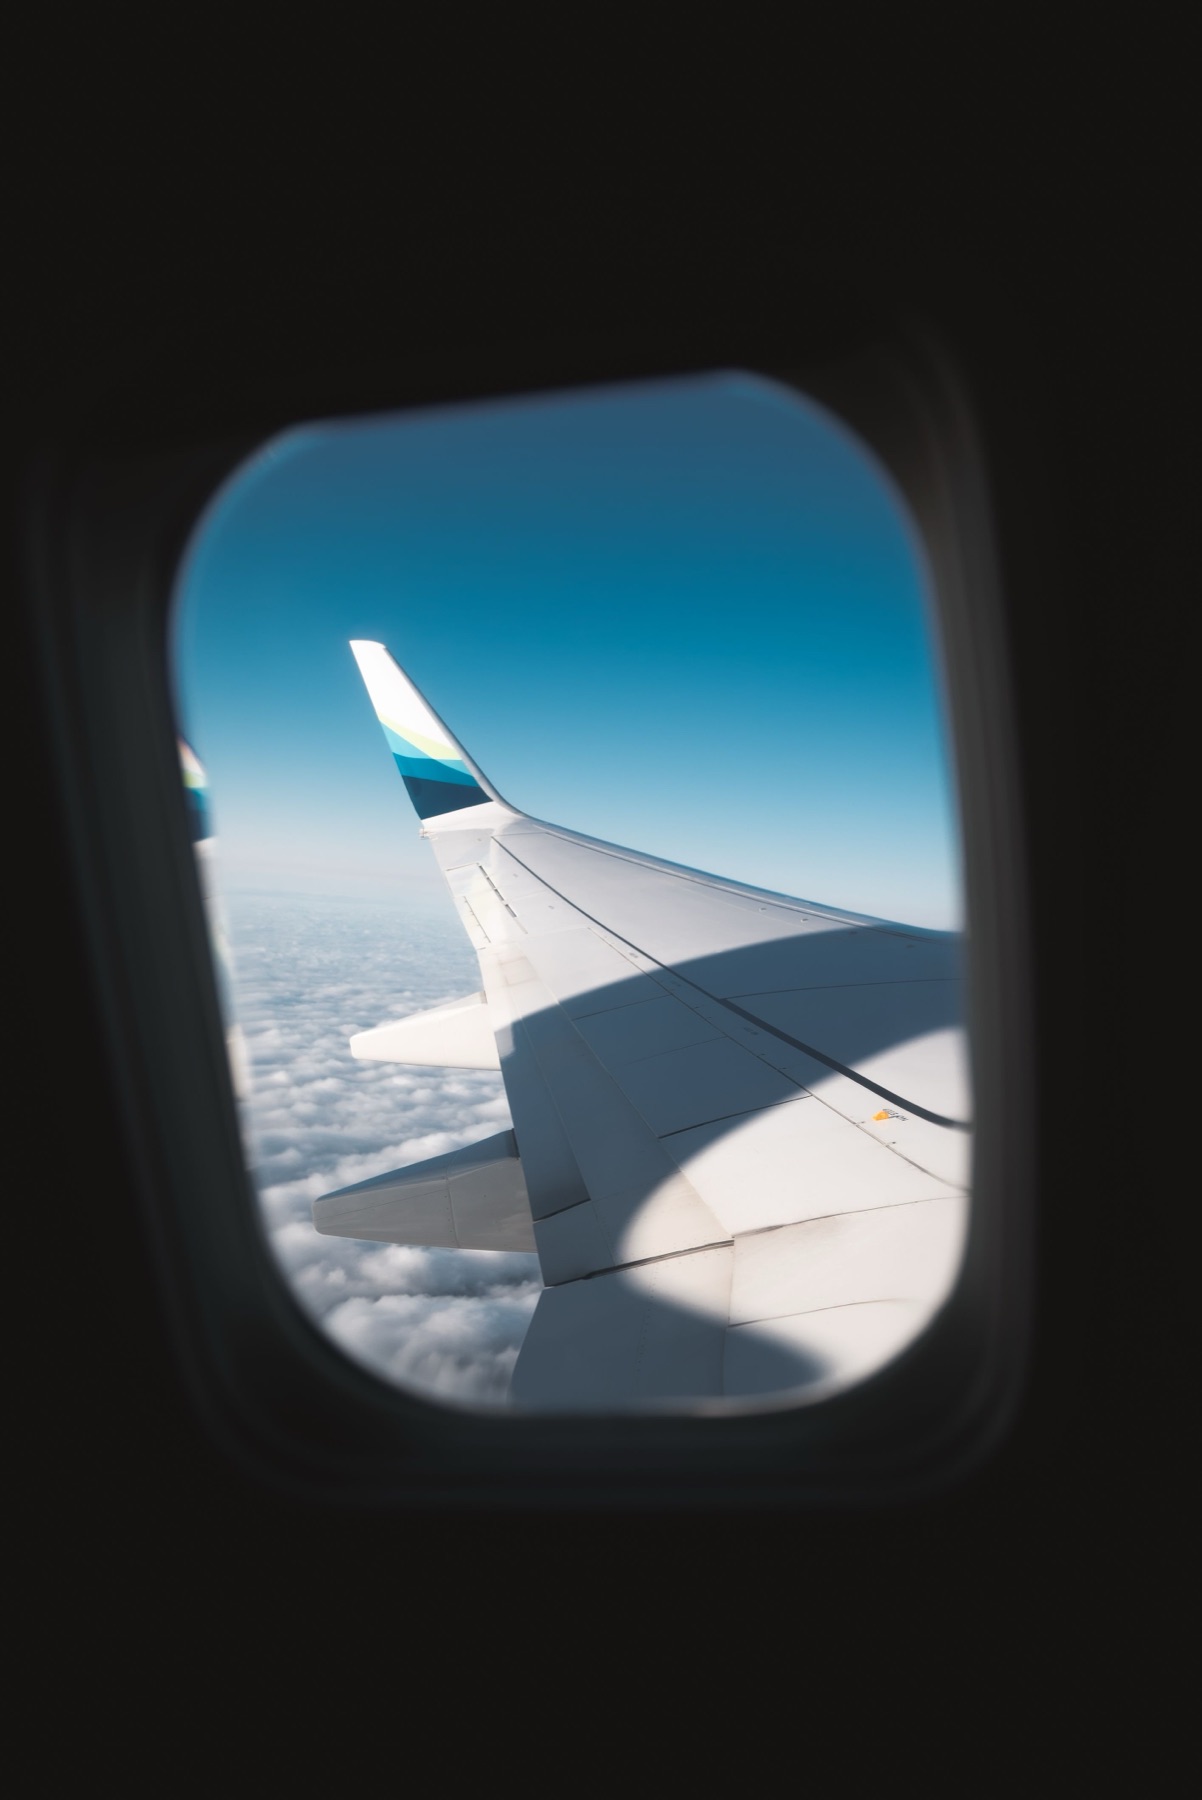
An aircraft wing seen through a cabin window, above the clouds

Mcloud turns messy aviation data into one intelligent, synthesised system. Schedules, ops logs, ADS-B telemetry and fuel records arrive disagreeing about the same flight; Mcloud resolves them into a single record of what each aircraft actually did, and keeps every answer it rejected.

AI then works on that record rather than on the raw files: it finds where delay starts, follows it down a rotation, prices what it costs, and says plainly when the evidence is too thin to call.
Mcloud is live.

Available to selected clients only.

Open Mcloud →

Rockwell

Hydropower & energy
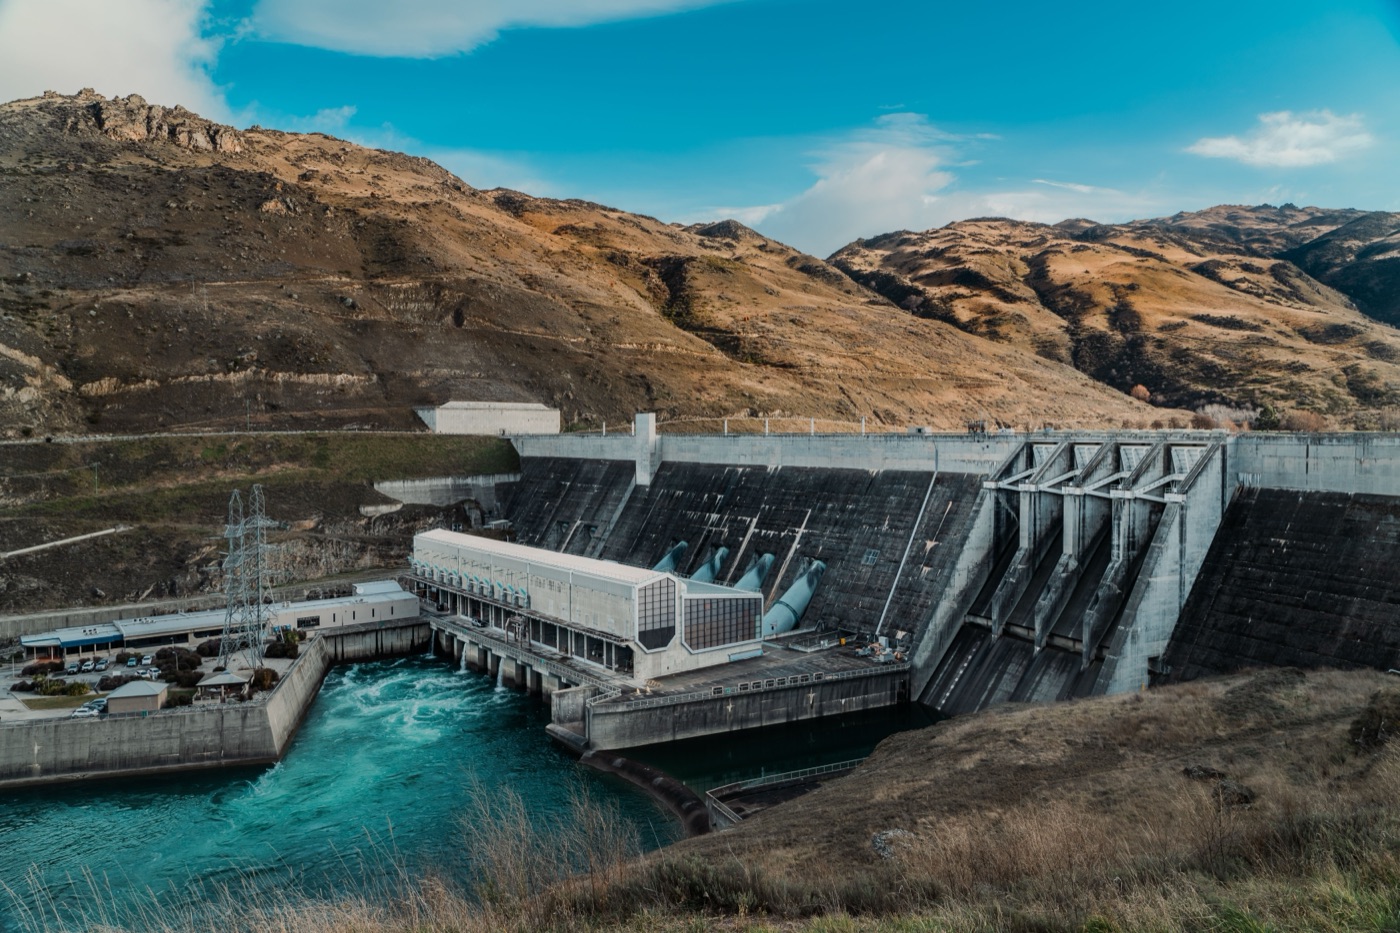
A hydroelectric dam and powerhouse on a river between hills

Rockwell is being built for land-based operations in hydropower and wider energy systems: plants, reservoirs, substations and the lines between them.

It will map how those operational systems are meant to connect and find the missing links: the sensor nobody reads, the handover no system records, the outage two databases disagree about. Each gap will be named, located and traced to what it costs.

Rockwell is available to selected clients only.

Maxray

Analytics & simulation
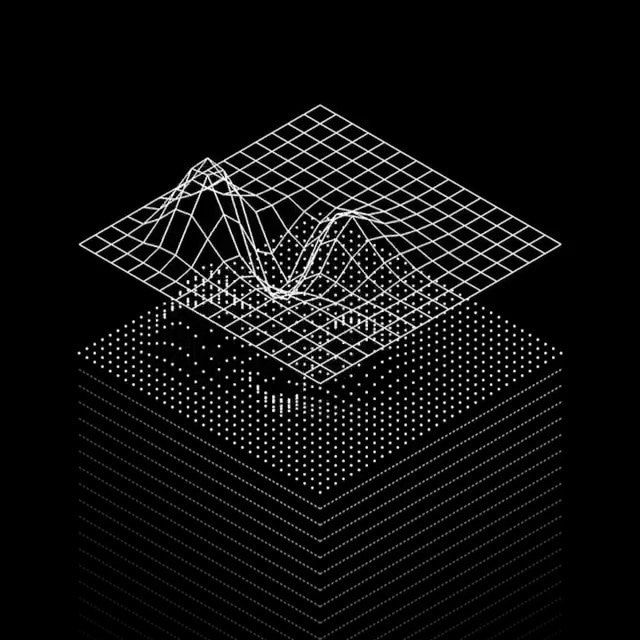
A wireframe data surface floating above a grid of points

Maxray is data analytics and simulation for operational systems. It uses machine learning and AI to find the structure in data an organisation already holds: the patterns, drifts and outliers no single report shows.

It then runs that operation forward. A model fitted to how the real system behaves can simulate conditions that have not happened yet: a plant down for a fortnight, a month of low water, demand arriving twice as fast. Each one is priced while it is still a question rather than a commitment, and where the record is too thin to train on, simulated data stands in for testing.

Models are fitted to each client’s own operation, and every result states the evidence standing behind it. A projection carries the range it could land in, and simulated data never enters the real record.

Maxray is available to selected clients only.

Enter

See Mcloud on a real operation.

Mcloud runs here on ten days of one airline’s flying, reconciled across its schedule, its ops log and ADS-B telemetry.

Wingates

Mcloud

Selected clients only. Enter the clearance you were issued.

Clearance